| 2023 November 17 |
|
It's been a while since we started our Patreon, so we're more than overdue for a status report. (A massive heartfelt thank you to everyone who has contributed!) In my mind I've split the work that needs to be done into four major sections:
Of course these are all interconnected in various ways, and work has gone into each of these four items already. I want to spend a bit of time discussing each of them in turn over the next couple of posts. Unimaginatively we'll start with #1, data acquisition and reconnaissance. I mention reconnaissance separately from acquisition because, as many of you are no doubt aware, during the pandemic each of Wizards, ChannelFireball, and Star City Games redesigned their sites and unceremoniously dismantled access to coverage of old tournaments. When we started working on the site we assumed that we could generate links to coverage by only storing the event code: for example Grand Prix Atlantic City 2015 corresponds to "gpatc15" which then was used to generate the URL http://magic.wizards.com/en/events/coverage/gpatc15. This is no longer adequate to link to source data; all these links broke. Wizards has said that event coverage would eventually migrate to their new architecture, but it's been nearly a year and I'm not holding my breath. ChannelFireball's coverage archive is apparently lost forever—I've heard that there aren't backups (though I'd love to be proven wrong here). Star City Games's archive still exists at old.starcitygames.com and/or static.starcitygames.com if you know where to look, but who knows when the plug gets pulled on that. (I also haven't been able to find everything there; if you think you're a good URL hacker and want to poke around in a black hole, talk to me on Discord sometime because I'm looking for some results that I haven't found yet!) Because we believe strongly that the point of the site is only to mirror data that exists publicly in other places, I've put a lot of work into probing what's been preserved on archive.org's Wayback Machine. My progress is in a Google spreadsheet at the moment, but at some point this will become the backbone of the events database, and all the links I've found there will propagate to the site. Our plan is to make a section of the site for coverage pages for what has been lost, so that we can be that public source for some of the lost data. For example if you want to see round 2 pairings of GP Austin 2020 (one of the lost ChannelFireball events), that should be on the internet somewhere, and we'll make sure it is. It also doesn't sit right with me that a new starry-eyed oaf can't come along in five years and start their own Elo Project because the data no longer exists. (If you think you might be that oaf, please don't do it, it's way too much work.) As a part of making the Google sheet, I personally added every missing SCG Open round to the Wayback Machine; if you're ever looking at data on the Wayback Machine and see a date from 2023, that data was preserved because of me.
I've received requests to add a bunch of different tournaments to the site, and my answer has typically been "yeah, probably, if the data exists." I've been focused on older events because the web scraping tasks are more challenging, but there are events from all eras that eventually will be included. Here's my progress on some of these:
|
 Basically every SCG Open is now preserved; I wish I could say the same about GPs, but many were gone before I started this process. Original data from the later part of 2019 and all of 2020 has been lost. (Plus of course the first 40-ish GPs never were on the internet to begin with.) On the bright side, I did unexpectedly find useful data from a 1997 Pro Tour that I haven't worked with yet, but I will soon.
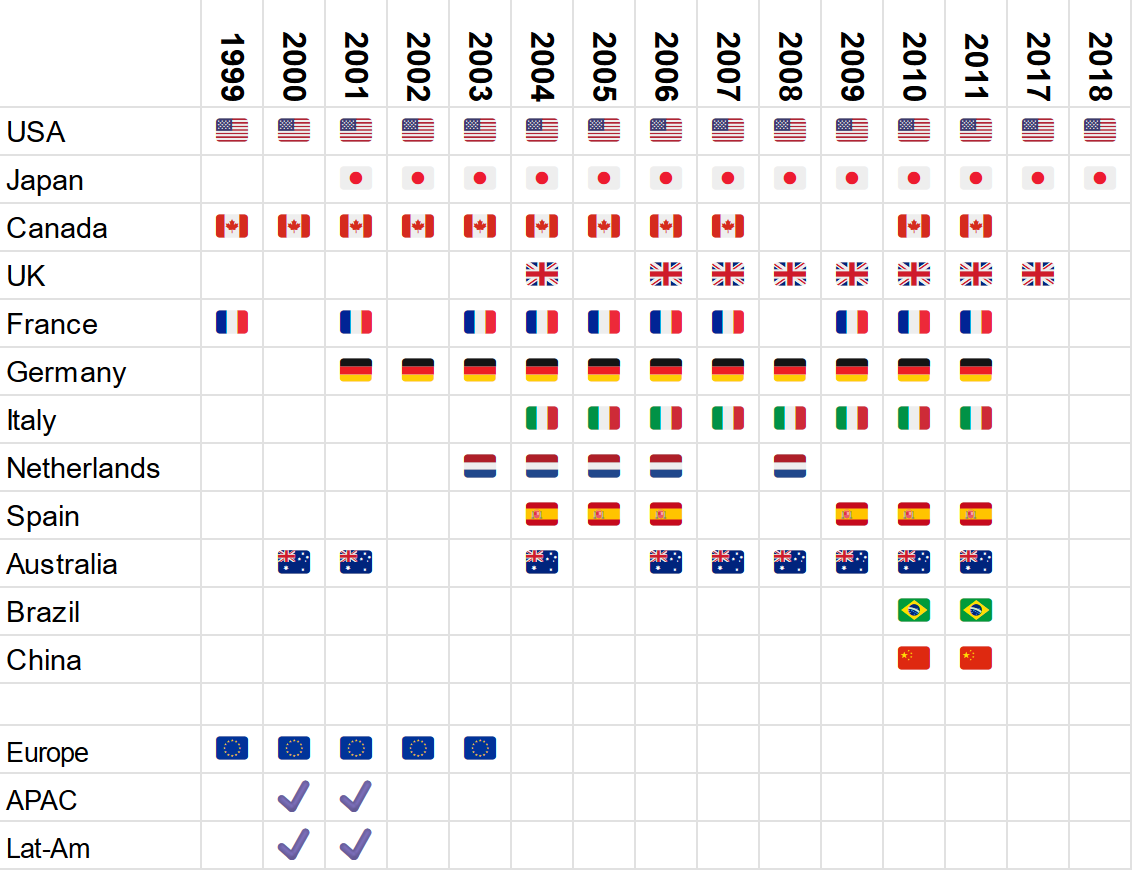 I did find a few of these events (Germany 01-05 and Netherlands 04) from country-specific sources, for example some Germany nationals results are still on the internet at
 | 2023 August 9 |
|
I've always wanted to improve my infographic game, but haven't taken as many steps toward doing so as I should have. I've looked at a ton of data in a lot of different contexts as part of working on the project, and while many of them are best handled with a spreadsheet or table of numbers, that shouldn't be the only tool in my box. Sometimes I also feel like my lack of infographic acumen constrains the kind of questions I'm willing to investigate, which is just bad science. With the advent of Regional Championships feeding the Pro Tour, I've been interested in knowing which region's participants have the best finishes. I guess the lack of World Magic Cup has left me with no outlet to root for players on geographic lines? I investigated this a little bit for PT March of the Machine, but vowed that for Barcelona I would make an interactive infographic so that you could see the data for yourself, or answer questions you didn't know you had. That infographic now exists, and I'm looking forward to building on this to tighten up some of the loose edges for future events. You can click on different invite types to see those players' positions in the final standings, or you can do the deck equivalent of this—click on a deck archetype name and see the distribution of that deck's finishes among the constructed standings. Wizards used to publish lists like "decks that had 27+ match points," "decks that had 24-26 match points," etc., but it didn't provide the ability to see succinctly how all pilots of that archetype did. That was the issue I was hoping to solve. Each competitor's circle also links to their decklist if you want to see the list exactly. I hope you have fun clicking around and turning the lights on and off! One of the themes of Elo Project 2.0 is to better synthesize the data that we make available here—this could take the form of letting you see "Elo notables" from tournaments that happened a decade ago, or showing you a player's performance season-by-season. This infographic points in that direction. More stuff like it is in the pipeline. As for PTLTR results by region, I think Europe was the clear winner: of 40 players attending who earned an invite via a European Regional Championship, 23 made day two, and 9 reached 30 match points (10-6 or better); this is the number needed to earn an invite to the next Pro Tour. Europe also put two players in the top 8. China unquestionably was second, and you can make an argument they belong first: 13 in the field came from China, 11 made day two, 4 got to 30MP. In contrast, it was an up-and-down showing from players who came from Dallas: 16/33 made day two and only 4 re-qualified. In total, 24/150 players reached 30MP from regionals. Compare this to the "pros"—those players who were in Barcelona because they had 39+ Adjusted Match Points from the first two PTs of the year. There were only 34 of them, and 15 reached 30MP! I'll be curious to see how AMP qualifiers parallel the old class of platinum pros as this organized play system continues to play out. |
| 2023 April 14 |
|
The regional championship that was supposed to be played in China leading up to PT Phyrexia in Philadelphia was beset by covid-related disruptions. Ultimately the competitors were unable to gather in one place, and so the event was broken up into four satellite tournaments. The eight Pro Tour invites were given to the finalists of the four events. This left the World Championship slot to be determined. The eight finalists from the December events convened at the regional championship in March in Beijing and played off for that honor. Thanks to the tireless work of @AbentuMtg, we have the results from that playoff, finally completing the December RC. (Sadly not the game scores; Chinese language coverage suggests the last match was best-of-five!) Given the unique structure, I put the event into the database as though it were a multi-flight GP, like GP London 2019 or GP Sao Paulo 2019 #2. The December satellite tournaments are rounds 101-108, 201-208, etc., and the Worlds playoff bracket is what's listed as rounds Q, S, and F. The original data from the December tournaments come from Melee:
|
| 2023 March 27 |
|
One of our motivations in starting the Elo Project was that we wanted to create a narrative of competitive MtG history. Sure there are individual tournament coverage pages (or uh…there were), but what if you want to look through the journey of one player—your favorite pro, yourself, whatever—and track their ups and downs through the years? What if you want to know whether Luis Scott-Vargas has ever beaten Paul Cheon in a high-level match? Or who has the best all-time win percentage in competitive sealed events? We wanted to create access to those stories, both the birds-eye-view aggregated history and the random snippets of personal history that might fall through the cracks without all of this data in one place. A few years ago, Yukio Kozakai stumbled upon just the sort of story that we hoped to help people find. I didn’t see his beautifully written Twitter thread until a few weeks ago, and he very graciously gave me permission to translate the thread and post the story here. I hope I did his storytelling justice. <3
|

| 2023 March 15 | ||||||||||||||||||||||||||||||||||||||||||||||||||||||||||||||||||||||||||||||||||||||||||||||||||||||||||||||||||||||||||||||||||||||||||||||||||||||||||||||||||||||||||||||||||||||||||||||||||||||||||||||||||||||||||||||||||||||||||||||||||||||||||||||||||||||||
|
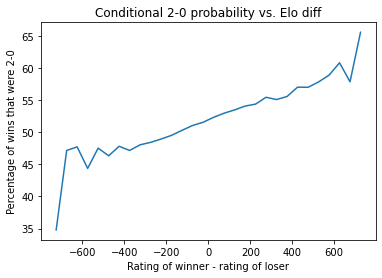
We're planning to regularly solicit stats questions on our new Patreon, and today I'm going to spend some time crunching numbers in response to one of the submissions. (This is also a fortuitous opportunity to answer a question that was apparently lost in our inbox from before the pandemic! I admit e-mail bankruptcy was declared at some point in 2021...) If there's something you've wondered that our data might be able to answer, drop us a line in a future post! While the game score does not factor into the rating calculation—the fundamental unit in competitive Magic is a match, not a game—it is still the case that the results pages typically come with a game score. Julian Wellman asks whether there's anything we can learn from the game scores. Questions abound here: is a 2-0 result vs. a 2-1 result random, essentially a coin flip? Is there a different distribution in GPs versus PTs? In limited matches compared to constructed matches? If there's a big rating gap between the two players, is the higher-rated player more likely to win 2-0? I'm sure there's plenty more that we can look at, but just touching upon these will more than fill up the rest of this post. Since we're going to be looking at ratings data, we should implement a provisional ratings period so that we don't look at a player until they've had a chance to get a little closer to accurately rated. To that end, I've ignored every player's first 20 matches. This also has the benefit of clearing out a lot of data errors, as most of them won't have 20 matches to their name. There are also some rounds scattered throughout the database that didn't have useful results pages; I was able to reverse engineer the results by looking at how the standings changed from round to round, but there wasn't enough information to create the game scores. Those rounds all necessarily got culled as well. Finally, I passed over any match that involved a player going 0-1 drop from an event; probably some small percentage of them represented Magic being played, but no-shows are represented as 2-0 wins and that could have a minor effect on the numbers. (Clearing day 2 no-shows would have been tougher but is certainly theoretically possible; that's a job for another day.) After we apply these filters, our dataset is 952,106 matches between "veterans" with a 2-0 or 2-1 result. Split by event type and format, here's the percentage of matches that end with a 2-0 game score.
It seems that matches are very slightly biased in favor of ending 2-0 rather than 2-1, and that this effect is stronger in limited than in constructed, and is weaker in PTs compared to other event types. I'm sure you can offer an explanation that's as good as mine here, but I'm not surprised that there's a minor correlation between winning game one and winning game two. I assume the ability to test specific matchups in constructed, plus the effect of targeted sideboard cards, likely accounts for some of the format effect? Why is it that PT matches are more competitive than others, more frequently going to game three? Maybe stratifying by rating will give us a partial explanation here. Possibly some of the effect is due to the players being more evenly matched, and if so we should see matches between players with similar ratings have a higher 2-0 percentage than matches between players with a bigger rating gap. Here's what we see:
Some thoughts:
Thanks again Julian for the question! I'd be more than happy to continue the discussion (on the patrons-only Discord, maybe?) and run more numbers for future installments. |
| 2023 February 23 |
|
Here's the tl;dr of this post: We have a Patreon now! Yay! If that's all we needed to say to hook you, here's the link to the Patreon. If you'd like to know more about our thought process and our goals for the site going forward, read on. For a little while the Elo project has sat at a crossroads. Ever since the pandemic, the site has been in long-term maintenence mode: we can add new tournaments to the site using our existing infrastructure, but that's about it. We haven't added features or improved the infrastructure since 2019. (Nor have we even kept up with the features that already are here; there was a year-long period where the graphs didn't work, for example.) There are a bunch of reasons for this. We made the site originally using skills we had acquired in 2007-2010, and we weren't web developers by trade at the time. Making the site was the perfect challenge for us—it was right on the cusp of our abilities, and we leveled up in all sorts of different areas as we first brought the project online. We've learned a lot since then, but most of the processes underlying the site were written in 2016 (and so on some level they're stuck in 2010). The initial concept of the project involved solely looking at GPs—the site was originally going to be grandprixelo.net. It seems obvious in retrospect that PT data should be here as well, but it wasn't clear to me at the time the extent to which the function of the site was going to be as a historical archive of events. Now we view the ratings as a fun little extra hook and the fact that you can go look up who LSV played in his 16-0 run at PT San Diego 2010 is the main point. On the other hand, many of these early choices leaked into the way the site was built, and it's not really possible to fix them without overhauling everything. We sat down yesterday to think of features we wished were on the site or ways in which our backend was organized differently and effortlessly came up with a list of twenty things. One of the most common questions we get is "do you have plans to include X"? Usually X is SCG Opens or Invitationals, or the NRG series, or Legacy EU tournaments, or MOCS, or Nationals, etc. Initially we tried to stem the tide on these questions by saying that we only were going to include events at the same "tier" of the organized play system, but with the phasing out of GPs, this makes less and less sense. How are the four-slot PTQs that were run at MagicCon Philadelphia at a different tier than the Regional Championships? And in that case, why were SCG Invitationals that awarded a PT slot to the champion different from GPs? If the point of the site is to be a clearinghouse for all the results that are (or once were) on the internet, we really should try to collect everything that's ever been out there. The issue is that adding these events, and clearing the other 19 things off our feature list, will take a lot of time and effort, and we no longer have our PhD theses to procrastinate from to make all of that effort feel justified without compensation. We both feel strongly that it's important for the site to be free and public, as we're just reflecting data that already exists in other places. (Uh, except the 2020 CFB GPs, we're the only source for them now.) And the site will always remain free and unpaywalled. But we need your help to be able to take the project to the next level: modernizing the site infrastructure, adding historical tournaments, improving the mobile interface, adding a public API to make our data more accessible, updating the ratings formula, adding new data visualization tools, and so on and so on. If you've gotten anything out of this project over the past seven years and you can spare a few dollars a month, you now have the opportunity to support the project via our brand new Patreon. In return you'll get access to some how-the-sausage-is-made posts, the chance to submit mailbag stats questions, and of course (most importantly!) you will help us take the site into the future and keep making it the best it can be. <3 |
| 2022 September 7 |
|
The new PT re-qualification system is based on something called Adjusted Match Points. Similar to how Pro Points were handed out at Worlds, the first three wins are discounted and after that each match point earned in the tournament counts toward your AMP total. After the system is up and running, it will take 39 AMP over the previous three events to earn an invite to the next one. (A top 8 is worth 39 by itself, so the top 8 are qualified for the next year.) If this had been the system in place all along, how many familiar faces would attend every Pro Tour? I ran the numbers on this for @mechalink on Twitter; the results are in this spreadsheet. Only two players—Reid Duke and Raphael Levy—would have had an AMP qualification to every one of the last 24 paper PTs. Most other players who attended 4+ PTs in this era had fewer AMP quals than PTs attended; this means that, in order to have the career they had, they'd need to manufacture other qualifications somehow. The biggest mismatch was Marcelino Freeman, who would only have had two re-quals from AMP but actually attended seventeen(!) PTs in this era. If he had to go to the regional championship all 15 of those other times, how many of the 17 PTs would he have played? This sheet made me believe that, to whatever extent there is a "train," it is much smaller than before, and we should relatively quickly see a lot of turnover in the makeup of the PT field. Don't read me as disparaging the system here—I'm just trying to describe and comprehend what's coming. We're coming from an era where success in 2017-18 was worth way more than one year's worth of equity; the pendulum seems to be swinging the other way. |
| 2022 May 30 |
|
On Twitter yesterday I shared the unfinished scraps of a Sporcle quiz that I couldn't complete. I still love the concept and I think some of the prompts are really clever, but finding twenty or so at the right level of difficulty was just too much for me alone. I don't want the quiz to be lost forever deep in my feed, so I'm preserving it here. There are exactly two cards that fit each of these categories. I'm going to tell you one, and you tell me the other. (The "answer" links go to Scryfall searches that find those two cards.)
Given how long it took me to come up with these, I'd say even 4/15 is an awesome score; some of them are quite obscure! |
| 2020 June 30 |
|
After the crowdsourced effort to collect the data from the missing 1998 PTs (we got NY to about 50% complete, but not much further, sadly), I decided to try to plug the missing holes in our knowledge of the decklists in the single-elimination round of PTs and Worlds. Our knowledge basically tracks with what was published in old issues of the Duelist/Sideboard, which is everything except the players who lost in the quarters of Dallas 96 and Worlds 97. I use this data for stats tweets and Sporcle quizzes, so I'm already in the habit of keeping it up to date. While the individual lists are floating around in a variety of places, I didn't know of a single spot to see everything, so I made one. If you ever want it, the data is in a .csv file stored at the GitHub repository https://github.com/ajlvi/pt-decks-csv. |
| 2020 January 03 |
|
One potential medium-term consequence of the recent announcement that next season's GPs won't have byes is that the Planeswalker Point (PWP) system could be sunsetted. I have no idea if this will happen, but GP byes were the last remaining use for PWPs after they reversed course on a proposed minimum threshold for participation in PTQs. The site is obviously not in active production; it's skinned for Magic Origins, a set that came out over four years ago; most of the achievements you can unlock refer to things from Tarkir block. So I don't think it's an outrageous step to think they could shutter it. Unfortunately the Elo project came into existence only shortly before an event which was from my perspective catatsrophic: an update to WotC's terms of service necessitated blanking out the names of everyone who hadn't accepted the new terms. If you look at your own PWP history you will see a sizeable percentage of your opponents are not identified. This percentage likely grows as you go back in time in your history, since some of your opponents from 2010 will have stopped playing and haven't had an reason to try to log into their Wizards account (at which point I think they'd be prompted to accept the new terms and I think they'd then start to appear). Over the past three years I've salvaged just about every round of premier event results that is on the internet, and as long-time fans of the project know I also salvaged some rounds that are no longer on the internet. But the missing-opponents issue seemed to make attempting to crowdsource information from our collective PWP history a non-starter. Yet the thought of the system going down without ever attempting to draw information from it seems like a waste, especially if something useful could possibly come of it. I admit that part of my hesitation stems from my own personal foibles: I've always felt like this is a "small fry" operation and so I don't really have the stature to go around asking things from people. This also has something to do with the fact that we don't have a donate button on the site despite people asking for it for years—I don't really know how to do it, or announce that we've done it, without feeling presumptuous. Trying to reconstruct a tournament from players' PWP history is going to be especially difficult because it's not enough to just talk to the people I know how to reach, the people who are still active in the community (Chris Pikula, Jon Finkel, Randy Buehler, etc.). We have to find the people who are no longer actively playing since then their names will fill in for their opponents. In the darkest scenario, person #1 would have absolutely no information to give me, but after they've accepted the terms then when person #2 gives me their history I would be able to see if they played person #1; person #3 would have both #1 and #2's name, and so on. The final participant to contact me would have everyone's history, and I would be able to fill everything in since I'd have seen at least half of each match. I only want to honestly try to do this for two events: Pro Tour Chicago 1998 and Pro Tour New York 1998. There are several reasons why I think these are more fruitful than a random GP from the same era:
The following sheet has the data for these two events: round-by-round everyone's opponents that I know, plus a sheet that has a list of every person that I need to contact. If you know how to get in touch with any of the people on this list and are willing to help out the project, could you let them know I'm looking for the entries in their history from these two events? They can either send me screenshots like this one -- 
-- or they go for a copy and paste text dump; that'd also be fine. I wouldn't say no to data from other GPs and PTs from 1996-1999, but like I explained above the two events I'm really looking for right now are ptny98 and ptchi98. Data could come to me either via mtgeloproject@gmail.com or DM to Twitter @ajlvi. Thank you for helping me on this unreasonable undertaking! |
| 2019 March 31 |
|
As I type this, the Mythic Invitational is winding down, with two MPL members and one challenger currently left standing. During the first two days, the record of challengers against MPL members was 23-27, for a win percentage of 46%. How does this compare to how these challengers have done against the MPL in These stats and more can all be found on our snazzy new MPL Head-to-Head Grid. (Click the link at the bottom to add in all the Invitational challengers.) Even more exciting (and the part that was fun to code) is that you can add yourself (or your friends, or your enemies) to the grid to see how you've stacked up against the officially Most Elite players. (Personally I am undefeated!) I'm excited about this feature not only because it's fun to see exactly how many times my friends have gotten their butts kicked by awesome players, but also because this gives me lots of ideas for expanding this sort of grid to be even more customizable. Want to make a head-to-head grid for your own playgroup? For the entire Hall of Fame? For everyone you can think of named Luis? Well stay tuned, as sometime in the moderately near future we will introduce a similar grid that you can populate yourself. And as always, if you have any other ideas for new features, don't hesitate to let us know! |
| 2019 March 05 |
|
After many starts and stops writing this entry, it is finally time to tell the story of Grand Prix Kansas City 1999. I added what I could salvage from this tournament to the site about a year ago—I have rounds 4 through 12 of the twelve rounds of Swiss, and a scattered few matches from the first three rounds. You may recall the puzzle I had to solve in order to reconstruct the Saturday matches of GP Philadelphia 2000. That was like trying to replace the batteries in an antique watch. Kansas City was like trying to put the watch back together after it was thrown into a muddy puddle and then run over by a truck. Fair warning, we're going to have to talk about not just usual tiebreakers, but second- and third-order tiebreakers soon. For context, coverage has come full circle in the two decades since gpkc99 (March 27-28, 1999). At the time Wizards's official site would have coverage ("cybercasts") for some tournaments but not all; pairings and standings for some GPs in this era were preserved because they appeared on third party sites. That might have been the tournament organizer, which is the case for gpkc99: the relevant information appeared on New Wave's site. Other GPs, like Seattle 2000, had text coverage hosted on the Dojo. Some of those pages migrated over to the official tournament archive, but not all of them; the official coverage link for gpkc99 points to a page that only has a text recap of the top 8. I've dug around quite a bit looking for references to other third-party pages that might have coverage on them, but haven't yet found any others that made their way onto the Wayback Machine. There's a small but nonzero chance that, for example, some of the missing European or Asian GPs once had coverage posted somewhere and I haven't had the good fortune to stumble upon them. New Wave's coverage archive has the suggestion of pages for other tournaments they hosted. The jewel among them is GP San Francisco 1999. Unfortunately the New Wave archive was only discovered by the Wayback Machine once, and almost all of the SF results pages timed out, so there isn't really any hope to reconstruct that tournament like we're about to do here. I wonder sometimes whether the .html files are still out there somewhere... I got the sense that the New Wave coverage was largely spearheaded by Alex Shvartsman, much as the Dojo coverage seems to have been orchestrated by Mike Flores in places. Is there a chance that gpsf99 is on a zip disk in his garage somewhere? I have similar questions about Pro Tour New York 1998 and Pro Tour Chicago 1998—those tournaments were at one time 100% on the internet but they didn't migrate to the current version of Wizards's coverage archive, and the Wayback Machine didn't capture every page from those two events. Are they sitting on a backup tape drive in a filing cabinet in the basement of WotC headquarters? As for Kansas City, the pages that were on the internet were captured but not everything was posted in the first place. Coverage starts with round three standings on day one, and with round 8 standings on day two. So I have pairings for rounds 4, 5, 6, 9, 10, 11, and 12; and I have standings (including all tiebreakers) for rounds 3, 4, 5, 6, 8, 9, 11, and 12. Yes, the GP only had twelve rounds of Swiss, six on each day. The day two cut was to the top 64, which worked out to everyone at 5-1 or better and one lucky person at 4-0-2. There was a second, much less lucky, person in 65th at 4-0-2. You could have shown up for this event with three byes, lost two matches, found yourself dead for day two, and dropped having played less Magic than you would have played at FNM. Also note that awkwardly round 10 standings are missing: the page exists but evidently the data was corrupted back in 1999. You'll notice that I only said "pairings," not "results." This is not a deal-breaker: we can make inferences as to the results of matches based on how the numbers of match points change from round to round. (Actually, the pairings themselves had lines like Finkel, Jon (414) 27 1 Rubin, Ben * (456) 24saying that Finkel, with 27MP, played against Rubin, with 24MP, on table 1. So the match point information is actually preserved with some redundancy.) But I also didn't say anything about the pairings in rounds 1, 2, 3, 7, or 8. They are missing. This is a big issue. It is also in some sense the opposite of gpphi00, where we knew the pairings and didn't know the results. That's much easier than knowing the results without knowing the pairings. Without even having standings for the day one rounds, there's not really any hope of recovering those, so I dismissed the possibility of recovering rounds 1-3 immediately. However I thought there was a real chance of reconstructing rounds 7 and 8, with the information we had, so let's make that our goal. The top 64 made day two, so there should be 32 matches in both rounds 7 and 8. The first drops didn't occur until after round 8. This can be verified from the way the score reporter printed the standings. As an example, here's the top line from round 8's standings. 1 Finkel, Jon 24 75.8333 94.1176 71.7677 5/5/0/3This says Finkel was in first place with 24MP; his tiebreakers were, in order, 75.83 94.11 71.76 (we'll learn about these soon); and then the last entry "5/5/0/3" says he played five matches, winning five, zero draws, and three byes. (From this you can deduce zero losses.) After round nine there are some people with lines like "7/4/0/1" implying they had dropped before round nine. But the round eight standings show everyone in the top 64 as having played eight matches. So at the start of the project we're 0/64 on matches deduced. That's a lie. Both round 7 (Paschover vs. Finkel) and round 8 (Price vs. Maher) had a feature match with text coverage, so there's two matches where we know who played whom. Also there are eight surviving tournament reports from archived snapshots of the Dojo which were written by people who made day two. Unfortunately a couple of the authors didn't know the names of some of their opponents, or elected not to include them. Still, after this free information, we are at 14/64. (Also those tournament reports got us a couple of matches from rounds 2 and 3... I'll take whatever I can get!) For several people we can see that their after-round-8 match point total is either six more than their after-round-6 match point total, or is equal to their after-round-6 match point total. In that case we know that they won both their matches or lost both their matches, but we don't know against whom. We also have some "loose ends," half-finished players for which we know one of their opponents but not the other. It's time to get our hands dirty. Magic tournaments track three tiebreakers. The main one, which is what is usually meant when someone just says "tiebreakers," is the average of your opponents' match win percentage. (This is called OMW, for opponent match win%.) For each opponent, calculate the ratio [player's MP] / [3 × rounds played], and then average those ratios. The caveat is that a number less than 1/3 gets replaced with 0.3333. Here's how we can leverage tiebreakers to discover something about missing opponents. This is Jon Finkel's opponents and their records after round 8. Note Jon had three byes.
  R4  Jamie Parke       4-2
  R5  Jacob Welch       5-3
  R6  Gary Krakower     6-2
  R7  Marc Paschover    7-1     [known from feature match]
  R8  [unknown]

    tiebreaker (omw)  75.8333 [known from R8 standings]
Okay, to be fair, we can deduce that Jon's unknown opponent is also 7-1 without doing math, since he should have been paired against another 7-0 player in round eight and he won. But still, let's see how this is done with tiebreakers. The information in the table above leads to the equation
$$\frac{1}{5} \left( \frac{12}{18} + \frac{15}{24} + \frac{18}{24} + \frac{21}{24} + x \right) = 0.75833 \text{,}$$
where x is the match point ratio of the unknown player. Solving the equation gives x = 0.87499. We know in this case that x should be a fraction of the form y/24; solving y/24 = 0.87499 gives y = 20.9998, so up to a rounding error we get that the unknown opponent had 21 match points, so was 7-1 after round 8.
Is this even good? There were sixteen people who were 7-1 after round 8, so all we know is that Finkel's opponent was one of those. (There are a couple we can rule out: it isn't Paschover, since they played round 7, for instance. A couple of them also have opponents known from tournament reports.) There are two ways we can proceed. We know Finkel's opponents going forward and we know the tiebreakers after future rounds, so we can learn extra information about the unknown round 8 opponent by looking into the future. Here's the situation after round 9. Note Krakower and Paschover make different contributions now than they did before since they played in round 9.
  R4  Jamie Parke       4-2
  R5  Jacob Welch       5-4
  R6  Gary Krakower     7-2
  R7  Marc Paschover    7-2     [known from feature match]
  R8  [unknown]
  R9  Lan D. Ho         8-1

    tiebreaker (omw)  74.0741 [known from R9 standings]
A calculation like before says that the unknown player's match win percentage is 0.7777, so they're 21/27, or 7-2. This shrinks the pool of possible players from 16 down to 7, as now we need someone who went 7-1 into 7-2. Since we don't have round 10 standings we don't get information about the unknown opponent's record after R10, but we can learn R11 and R12 from the extant data. This "signature" of a player's R8, R9, R11, R12 records often identifies them uniquely, or at worst will make them a member of a set of at most two or three people. It's possible that there will be two people with a given signature but we know the R7 and R8 opponents for one of them, and if that happens then the fact that the signature wasn't unique won't actually hinder us.
Let's look at the second way to accomplish this, with the second and third tiebrekaers. The second tiebreaker is your own game score: it's the number of "game points" you have earned divided by three times the number of games you played. Game points are like match points; you earn three points for a win, one point for a draw, and no points for a loss. As such a 2-0 win counts as 6/6 game points, a 2-1 win counts as 6/9, etc. Draws are annoying for game scores, since it depends on reporting the correct kind of draw. If you draw because game three didn't reach a conclusion, that's a 1-1-1 match result, so 4/9 game points. If you ID, that's an 0-0-3 match result, so 3/9 game points. If you draw because game two finishes in extra turns and you don't get to start game three, that's a 1-1 match result, so 3/6 game points. This never matters in practice, but in doing tiebreaker math I've noticed that occasionally draws are put in as 1-1 (3/6) instead of 0-0-3 (3/9) like they're supposed to be. The final tiebreaker is the average of your opponent game point percentages. (This is OGW, for opponent game win%.) As with match points, there is an artifical floor of 0.3333 imposed on your opponents who have own game scores below that percentage. The second tiebreaker will report a number less than 1/3, but the number that gets used in the third tiebreaker calculation will be inflated to 1/3. Let's look at Finkel again post round 8, this time examining the game scores of his opponents. Usefully the game scores can be read off of the round 8 standings, since those are the second tiebreakers. So we don't have to try to reconstruct game scores for all the previous matches in order to use the third tiebreaker.
  R4  Jamie Parke     72.7273
  R5  Jacob Welch     55.5556
  R6  Gary Krakower   75.0000
  R7  Marc Paschover  77.7778 [known from feature match]
  R8  [unknown]

    tiebreaker (ogw)  71.7677 [known from R8 standings]
This means that, like before, the opponent's game score percentage solves the equation $$\frac{1}{5} \bigl(72.7273 + 55.5556 + 75 + 77.7778 + x\bigr) = 71.7677\text{.}$$ The solution is x = 77.7778. Now we are looking for someone whose own game percentage (second tiebreaker) is 77.7778 and who has 21 match points after round 8. There are only three such people: Tony Tsai, Craig Dushane, and Marc Paschover (who is ineligible to have played Jon round 8). We can go deeper and reach a conclusion now: Tsai entered day two at 6-0 and Dushane entered at 5-1. We know that Jon played another 7-0 and beat them, since Jon winds up on 24MP and tiebreakers showed his opponent ended up at 7-1. Therefore only Tony Tsai could have been Finkel's opponent. It took seven paragraphs and ~1000 words, but we now are 15/64. Did you notice that there was something special about Jon Finkel that made the calculations possible? Puzzle that for a paragraph. To recap, there are two different pairs of information that can help shed light on unknown opponents: we can use the combination of the first tiebreaker (OMW) together with players' match points, or we can use the combination of the third tiebreaker (OGW) with the second tiebreaker (the games equivalent of match points). Using these, we can build a signature of the unknown opponent's record in future rounds. Eventually hopefully this process will narrow down the set of possibilities to one player, or at least one player among those that are unaccounted for. We started with several "loose ends" since we knew only one of the two opponents for several players who happened to have played one of their rounds against someone who wrote a tournament report. We pray that filling in loose ends will create other loose ends and we will eventually untangle all 64 missing pairings. The thing that was special about Jon Finkel is that he had three byes, so we had otherwise total knowledge about all his other opponents. Let's jump from Finkel to Tony Tsai now. He only had two byes. Here's what we know about his tournament so far. (Remember, annoyingly, we don't have R7 standings.)
                       R8 record     R8 game pct
  R3  [unknown A]
  R4  Danny Speegle       3-2          60.0000
  R5  Mike Caselman       4-2          56.2500
  R6  Devon Herron        6-2          68.4211
  R7  [unknown B]
  R8  Jon Finkel          8-0          94.1176

    R8 tiebreakers      71.1111        66.2500     [omw / ogw]
How can we make progress when there are two variables in the equations? Don't forget that we have information after round 6, too! The best possible result for us is if Tony's round 3 opponent did not make day two. If that's the case, then the record of the unknown round 3 opponent will not change between round 6 and round 8, and the first line of blanks will get filled in, ready for use in the round 8 calcuations. With this in mind let's strip off rounds 7 and 8 and look at the end of day one standings.
                       R8 record     R8 game pct
  R3  [unknown A]
  R4  Danny Speegle       3-2          60.0000
  R5  Mike Caselman       4-2          56.2500
  R6  Devon Herron        5-1          71.4286

    R6 tiebreakers      65.0000        60.8085     [omw / ogw]
From this table we infer that Tony's round 3 opponent had a .5000 match win percentage (either 2-2 or 3-3, we can't tell but it doesn't matter) and a game win percentage of .5556. Usefully, they did not make day two. So their contribution isn't going to change between rounds 6 and 8. We can go back to the first table and fill in the static information about unknown A, leaving us only with unknown B to consider.
                       R8 record     R8 game pct
  R3  [unknown A]         2-2, say     55.5556
  R4  Danny Speegle       3-2          60.0000
  R5  Mike Caselman       4-2          56.2500
  R6  Devon Herron        6-2          68.4211
  R7  [unknown B]
  R8  Jon Finkel          8-0          94.1176

    R8 tiebreakers      71.1111        66.2500     [omw / ogw]
This table implies that unknown B was 6-2 after round 8 and had a 63.1555 game score. Only one person fits that bill: Justin Holt. Since both entered day two at 6-0 and Holt is now 6-2, the result of the round 7 match was a win for Tsai. 16/64! (As a footnote, nobody after round six had nine match points and a 55.55 game score. But there were fourteen people who were 2-2 with that game score. Since they dropped after round 4 there's not much hope of figuring out who they were.)
What would we have done if Unknown A had made day two? I think the only logical options are panic and despair. The problem in that case is that the contribution that Unknown A would have made to the round 6 tiebreakers will not match the contribution they make to the round 8 tiebreakers, so learning where they were after round 6 isn't particularly helpful. Many of the players who made day two had one or zero byes, so in place of our single mystery player we would calculate from the round 6 standings a sum of two or three mystery players' statistics. If the stars align and none of them made day two, then their agglomerated tiebreakers will contribute the same amount towards round 8, and we can then isolate the single missing person just like what we did for Tony. You should probably be asking right now, if we're in a situation where there are multiple unknown day one opponents getting clumped together, how would we know whether any of them made day two in the first place? It shows up when you try to calculate the unknown day two opponent's information from tiebreakers. We're expecting to see match win percentages of .8750 for a 7-1 record, .7500 for a 6-2 record, or .6250 for a 5-3 record. (A couple of players have draws, but excluding those for now these are the only options. Two players were 8-0 and we have them taken care of.) Suppose we infer a match win percentage of .8525; that would be 20.46 match points out of 24. That's bad news. A result like that means that something is wrong upstream—someone from day one is making a different contribution to round 8 than they did to round 6. Unfortunately that player's tiebreakers are then useless, since we can't isolate the signature of their unknown day two opponent. I didn't calculate tiebreakers for everyone, since both opponents were already known for whatever reason for several people at this point. Of the players I did calculate, eleven had useless tiebreakers. This adds a level of suspense to our excavation effort, since at the bottom of our well is now a swill of uncertainty. I mentioned draws in the previous paragraph. There were six people whose round 8 match points differed from their round 6 match points by 1 or 4. Those people had to have played each other in at least one of their matches. For a couple of them one of their non-draw result was known, and so then that forced their other match to be a draw. The location of the six draws was comparatively easy to isolate. You may recall that our over-arching plan was to pull on loose ends (players for which one of their opponents' identites is known) until our knot untangled. I have sad news: we won't get to the finish line this way. At some point in the high 30s I got stuck; all the loose ends involved people with useless tiebreakers, so I needed one new idea to get to the end. Let's look at Eric Lauer, who had three byes but didn't have either of his opponents' identities uncovered up to this point. He goes from 5-1 after round six to 6-2 after round eight.
                       R8 record     R8 game pct
  R4  Brent Parr          7-1          75.0000
  R5  Devon Herron        6-2          68.4211
  R6  Joel Noble          4-2          61.5385
  R7  [unknown A]
  R8  [unknown B]

    R8 tiebreakers      75.8333        66.2551     [omw / ogw]
The goal is to try to tease apart the two missing data points from their sum. For match win percentage, the contribution of A+B is 1.5 in aggregate. Multiplying by 24 tells us that A+B had 36 match points altogether. Either they were both 6-2 or one was 7-1 while the other was 5-3. Assuming that there aren't any pairdowns, the first situation can't occur! This is because Lauer either goes WL or LW. If it's WL, then opponent B plays him in round eight where both are 6-1, and Lauer loses, so B winds up 7-1. Otherwise opponent B plays Lauer in a round eight match where both are 5-2, and Lauer wins, so B winds up 5-3. There aren't many 7-1 slots to go around at this point, so this is possibly useful already. Even more powerful is to look at the aggregate contribution of the game win percentages. The contribution of A+B to OGW is 126.30. I then wrote a program in Python to look at every possible way that two own game scores (second tiebreakers) could add up to 126.30, and it turns out that the only pair among the ones that were left at the time is 68.42 + 57.89, and only Jeff Matter has a 57.89 second tiebreaker. Even better, only John Lagges has the combination of a 68.42 second tiebreaker plus a 7-1 record. (Nobody has 68.42 + 5-3.) So now we know that Lauer plays Matter + Lagges in some order. This potentially gets us un-stuck, since now both Matter and Lagges are "loose ends" as one of their opponents is known. We just don't know whether Lauer plays them in round 7 or in round 8. Further down the line this thread of reasoning hooked into someone with useless tiebreakers, for which one of their opponents was already known. That then snapped everything we had done so far into place.
These ideas plus a lot of patience were able to determine all 64 matches. My first attempt at this didn't go well because I think I made some pretty shaky logical conclusions from useless tiebreakers somewhere early on in the process. For my second, successful attempt, I tried to be meticulous in note-taking so that I would have multiple save points in case something went south. Here's my main thread of notes (PDF), containing the 64 matches deduced in order. Here you can see my furious scribbling (JPG) trying to work out information about unknown opponents; this goes on for several pages. In the image you can see me working out the records for an unknown opponent in future rounds (boxed in each table). Sometimes I'm able to figure out the identities. For others, OGW calculations had it limited to a couple of people before I started—you'll see in the table in the middle that Ferguson's R8 opponent was either Stanton or Lewis, and the fact that the unknown opponent made OMW contributions of 18/24 and 18/27 in rounds 8 and 9 meant it must have been Lewis. Most of these calculations wound up in a spreadsheet that I used to track my progress. I should add that there are two other places where I had to use this technique to recover lost pairings: GP Kuala Lumpur 2000 round 10 and Pro Tour Los Angeles 1998 round 4. These were significantly easier due to (a) having total information about all previous rounds and (b) only needing to reconstruct one round instead of two consecutive rounds. ptla98 R4 is the only one of these that took place on day one, so at the lowest tables we are trying to determine identities of players who had 0-3 records. This is typically impossible because the .3333 floor artifically obfuscates players' identities. Still, I was able to recover 156/164 matches, which I'm treating as a win. I believe that I could reconstruct all of the missing days of ptny98 and ptchi98 if I had the standings after each round, but sadly the standings are on the tape drive backup in the basement right next to the results and pairings. I'm hoping I never have to do this again, though if it means more data on the site and we come across data that needs to be rebuilt I'm absolutely up for the challenge. |
| 2018 December 14 |
|
I finally got to the bottom of my pile of grading and that means it's time for World Magic Cup stats! Data in this table covers everything that's on the site—individual pro tours and Grand Prix dating back to mid-1998, with data getting spotty in late 1999. (See the FAQ.) You can sort this table by clicking on a column heading. Note that with only three people on each team, the middle rating is the median. If you'd prefer to limit the sort to only the teams with three rated players, here's the average sort with those teams filtered out. Mouseover a rating to see the name associated with it, or click on a country to make the names appear. The blue rating is the team captain and the red rating is the national champion. For some countries those two people coincide (hence the purple), while for some others either the pro points champion or the national champion declined their invite. Best of luck to all participating teams! |
| 2018 October 06 |
|
Besides tournament results, there's another area of the Magicsphere which possesses a vast well of data that can be mined and analyzed: decklists. About a year ago I put together a database of decklists from Pro Tour and World Championship single-elimination rounds, and I've made tweets and Sporcle quizzes about some of the interesting tidbits I've found in them. I also like to play mythic bingo where I track how many different mythics have appeared in the 5-0 Magic Online standard league deck dumps. I've been playing a pretty rogue modern deck lately (WR Death and Taxes) and I've been looking for a tool that makes it easy to see things like "has card X ever appeared with card Y" or "has anyone ever tried Z in the sideboard", etc. While I have been able to answer my questions on other sites, the number of extra clicks and/or simultaneous open tabs has gotten to me. So I made a crude tool for myself, and I think it might be useful enough to other people that I'm sharing it with you here. Behold the modern 5-0 decklist sandbox. (There's now also one for legacy and standard.) The page will display information about how to use it when it is first loaded. This lets me answer questions that otherwise would have been out of reach, like "how many cards have appeared in every single deck dump?" or "which Eldrazi have made it into a 5-0 list?" or "who has had the most decklists published?" etc. There's a lot of fun questions you can answer with the sandbox, besides the original purpose of hunting for decks that have specific cards in it. (If you give it a list of cards and a list with those cards has been published a link will appear.) Since I made these sandboxes primarily for personal use there are probably some design decisions that are a little idiosyncratic. But if you have any suggestions or feature requests, let me know and I can see if I can add them in. Enjoy! |
| 2018 September 13 |
|
The World Championships are nigh! I've been posting stats to Twitter recently but haven't done a good job cataloging them here. My apologies... it's easy to feel like I'm done after I've fired off the tweets, but I should really do a better job cataloging my statistics projects in this space for people who aren't following me there. (Having said this, I do feel like the percentage of stuff I produce that is of a quality to appear here is not 100%, so if you want to see some half-baked numbers you might try following @ajlvi on Twitter.) You can find the following information on the twenty-four Worlds participants: a lifetime head-to-head grid (Reid Duke's 45-32 record against the other 23 players is pretty impressive), a breakdown of each player's sesaon (basically what you'd hope to see on the back of each player's baseball card in the "2017-18" row), elo-based metrics for each player (Brad Nelson's 2222 average Elo throughout the year is quite eye-popping), and the ever-controversial, just-for-funzies, have-I-ever-told-you-Elo-is-a-crude-tool results of simulating the tournament 2.5 million times using either Elo or average Elo as the only determiner of wins and losses. Of course the probability of winning will line up with the list of everyone's Elo in descending order, but the interesting thing to pay attention to here is the margins — it gives you some idea as to little a deal one rating point is. If I were a bookmaker I wouldn't set betting lines based on these simulations, but I would use it to remind myself that the margins are going to be very thin this weekend. Good luck to all! |
| 2018 July 25 |
|
Here's a challenge for you — the kind of task you'd have to solve on an Elo project job interview. I'm recording it here so that I know where to find it in the future. At Grand Prix Chiba last weekend two different people with the name Ryo Takahashi registered for the event. Both of them went 6-2 on Saturday and advanced to day two, when someone realized that there were two people with the same name. In Sunday's rounds the two players have the last four digits of their DCI numbers attached to the end of their names so that they can be told apart. But if you look at, say, the round 4 results, you'll see two people with the same name. Using the tiebreakers of the two players (and some of their opponents) you can figure out whose day one results are whose. See if you can accomplish this. The correct answers are here on the site if you want to check your work, and of course I'd be happy to provide explanation if you want to know how to do this. It took me about twenty minutes to disentangle the two players' results, and my guess is that if you have never tried to do anything like this with tiebreakers before that you're going to need to set aside at least an hour to figure it out. |
| 2018 June 07 |
|
I became aware last week that the version of Wizards's site that I thought was the oldest one that was archived by the Wayback Machine was in fact not the oldest. An older version from the 1998-99 era included coverage ("cybercasts") of PT Chicago 1997, PT LA 1998, PT NY 1998, and PT Chicago 1998. Unfortunately these pages were only trawled a couple of times: incompletely in early 1999 and unsuccessfully in late 1999. When the site was redesigned sometime in 2000, the cybercasts were not ported, and all future sites have copied off of the information available in the 2000 version. I also saw rumors in a post on the Dojo that Worlds 1997 may have had some sort of internet coverage, but it predates even this older version of the site. Here's the status of those PTs: ptchi97 is relatively complete, but day one information was never posted in the first place because of technical issues at the tournament site. The cybercast only consisted of standings, so it would be a challenge to try to get pairings out of nothing. The three from 1998 are more promising: pairings and standings once were on the internet. ptla98 is intact except for round 4, but the Wayback Machine failed to capture any of ptny98 day two or ptchi98 day one. (There was one intervening event, PT Mainz 1997, which didn't have a cybercast at all.) I've reconstructed 156/164 matches from ptla98 R4 from tiebreakers, and that tournament is now on the site. I don't think there's hope to reconstruct the others from what's available. I can almost imagine getting ptny98 back together if we had the final standings and tiebreakers; day two rounds have a small number of matches and the tournament reports that exist will fill some of it in, which might give me a toehold. On the other hand ptchi98 is missing day one, which is a much bigger disaster—the rounds are bigger and people will go 0-4 drop which means they won't show up in tiebreakers except as the minimum .3333. This makes it impossible to recover their matches from the standings. Still, I thought that after I added Kansas City 1999 that I wouldn't have any more old data to add, so getting another Pro Tour is pretty cool! Now I'm aware of five tournaments that were once on the internet that aren't on the site. Here's hoping that someday I'll get extra information which lets me rebuild them! Next post (which may not be for another month or so) I'll discuss the reconstruction effort of gpkc99. |
| 2018 March 08 |
|
I promised a while ago to talk about the reconstruction effort I underwent to recover Grand Prix Philadelphia 2000. Fair warning: things may get a little technical ahead. In a round of a typical tournament, three pages of information are generated by the event reporter: a list of pairings at the beginning of the round, a list of the results of each match after all the match results are put into the system, and the standings as of the conclusion of the round in question. For our purposes, it's the middle one of those three that's the most useful, because we need two pieces of information for the dataset: (a) who played whom and (b) what the match result was. The results page just tells us that straightaway. Strictly speaking the results page is a convenience, since the information in it can be reverse-engineered from the rest of the coverage. If you know everyone's match point total as of round N-1, and you know the pairings for round N, and you can see the standings after round N, then we can figure out the results from round N. A player won her match if her match point total after round N is three more than that after round N-1, lost it if that difference is zero, and drew if the difference is one point. Sometimes the results pages are corrupted in some way (the most typical error is the round N results page being the same document as the round N-1 results page) and I use this method to recover the data for the site. You can imagine I wasn't impressed with the coverage page for GP Philadelphia 2000: none of the rounds have a results page at all, and the first time we even see standings is round 6. This means for round 7 onward we can recover the results by using the method outlined above. (Round 6 doesn't work because I don't know the starting number of match points — those would be in the round 5 standings page.) Then I crossed my fingers, because sometimes the pairings pages include the MP totals. These don't. All I knew about the first six rounds are the pairings. Would that be enough to recover the results? On the face of it that may sound crazy, but there's reason to believe that there may be enough data here to figure everything out. The results for some people will be immediate from their match point total: if they have 18 match points won every match they played and if they have 0 match points they lost them all. This will distribute some losses to people who played the 18MP players and some wins to the people who played the 0MP players. Maybe after that sweep is done we'll have assigned a loss to some people with 15MP (= 5-1 record), so we'll know they won all the rest of their matches, or maybe we'll have uncovered a win to someone with 3MP, so they'll have had to lose all the rest of their matches. (Note that 3MP could have been a record of 0-x-3 or 1-x, but since we've found a win for that person, their quantity of points left to assign is zero.) Then we get to go back and take a second pass, looking for byelines that can be completely filled in. In a perfect world, this initial cascade might fill in all six rounds. There were 582 people in the tournament, and the successive passes filled in 86, 52, 34, 28, 16, 13, 7, 6, and 2 people, for 244 total. That's something, but not everything. Most of the other players had some matches filled in, just not all of them. As an example, after my first sweep my Python structure had an entry of the form
Lowery, Brett 12 .W..L. [12, 0, 3, 12, 12, 9]
meaning Brett had 12 MP after round 6, with a win round 2 and a loss round 5 already accounted for. The list at the end stored the match points of all six of Brett's opponents. The possible results a player could have were W, L, D, B(bye) and X(drop). The pairings pages told me who had a bye in each round, so I at least had that going for me. A player dropped when he stopped appearing in the pairings. Thankfully nobody left and came back somehow.
The goal now was to find ways to get myself "unstuck". If I could puzzle out an individual player's results somehow, then we could resume the cascade; even filling in one match might lead to settling a substantial number of players. The big cache of information that I've left untouched so far is the fact that the pairings are done by the Swiss system, meaning the identity of your oppoents encoded some information about your record at the time of each match. I'll try to illustrate with examples some of the techniques I used to tap into that data. I believe the list below is exhaustive in the sense that, by applying the observations below, together with cascading, was enough to recover all the results.
Maybe there was one other item that I've forgotten about, but I believe these were the only methods that I used to fill in every result from the first six rounds. I was a little astonished at the end that everything was not only filled in, but also internally consistent; I think that illustrates how much information is already contained in the standings. My goal was to use the lightest touch necessary to recover all the results; I'm sure there's other ways to draw the same conclusions, but I wanted a set of axioms that would let the rounds fill themselves in as much as possible. This way if something went wrong there would be a more limited place to look for inconsistent hypotheses; this is especially valuable since future deductions depend on previous work. Unfortunately for the other big reconstruction project (GP Kansas City 1999) things need to be done more by hand. More on that job another time. I should address the question about whether the results I reconstructed are unique, or if there's some other way to fill in the grid that would assign everyone the appropriate number of match points. This mainly depends on whether there was a three-point pairdown really early in the process, since future deductions are based on previous results. I'd be somewhat surprised if what I came up with wasn't an exact match to historical fact, or at least was really close to it, so I ultimately decided to include the reconstruction on the site. It would be nice to try to reconstruct the data in a different order to check for discrepancies, but I admit I'm not optimistic that I'm going to have the time or motivation in the near future. If anyone else wants to torture themselves and go through this, though, I'd be happy to compare our results! |
| 2018 March 04 |
|
I've been good at updating the site but not so good at recording my updates here. Since the last blog post, here's what's happened:
|
| 2017 December 24 |
|
I got interested in checking in on the leaders among matches played in calendar year 2017, since the last tournaments of the year are over. Here's a table of stats. There are a variety of ways to try to measure performance over the span of a year. The most straightforward is win percentage, and in that metric Huey Jensen (87-31, 73.73%) laps the field. Among people who played 100 matches, he's almost 5 percentage points above second place, Fabien Li (93-42, 68.89%). Even if we admit anyone who's played 75 matches, the second best becomes Jeremy Sager (56-23, 70.89%). Average Elo may do a better job of capturing who has had sustained excellence throughout the year. To keep your Elo rating over 2000 you can't have any stretch of mediocrity. Not only do you need to be winning a large percentage of your matches, but you need to consistently post that percentage week to week or you'll see fluctutaions in your rating. As it's easier to lose points than gain them when you're at 2000+, those fluctuations will ultimately bring down your average. There are 71 people who had an average rating of 2000 this year (while playing 100 matches), and the table in the link above shows all of their seasons. On this measure, two people who played 100 matches and maintained a 2200(!) average rating throughout the year, pacing the field: Brad Nelson (2221) and Huey (2218). Both touched 2400 at some point during the year. Another option is to look at minimum Elo. With average, if you somehow were to oscillate evenly between 2000 and 2200, you'd wind up with an average of 2100. But the highest rating you actually maintained was 2000. This is a cruel stat, since it will punish people like Huey who had a crazy high in the middle of the year but happened to begin last January with a less ridiculous rating (he started his first event, PTAER, at 1980). The winner here is Owen Turtenwald, who never went below 2060 at any time all year. His average rank after weekends with tournaments is 15th, and he only was outside the top 30 for one weekend. There's a reason we call 11-4 at a GP the ORAT special: the man is wildly consistent. In fact, Owen has the longest active streak of matches with a 2000+ rating: 469, dating back to the 2015 World Championship. Brad Nelson is the only other one who can say that his streak goes back to 2015. His streak of 428 matches began at GP Atlanta 2015. As always, if you have suggestions for statistics, I'm happy to crunch numbers! |
| 2017 December 10 |
|
Last week I added two more years to the site, getting us back to Worlds 2003. I've already scraped back to Worlds 2001 — all 60 tournaments exist, though there's a round missing in one of them. At this point there are 153 tournaments left not on the site. Probably about 100 of them can be acquired, and in the next update I'll get a majority of them done. In absolute terms, there are 490 tournaments on the site out of 643 total, for 76.21%. In terms of matches, there are about 1.997 million matches on the site and I think there are about 225,000 matches missing, meaning we're close to 90% on that scale. With this update we also reconfigured the architecture of the database. We're a little closer now to how it probably "should" have been done from the beginning, but we were young and foolish at the start and have learned a lot from working on the site! As an end user you should experience benefits from this restructuring in a few different areas:
|
| 2017 November 29 |
|
It's time for another World Cup! It astounds me how much the site has grown — last year when I was making this table I didn't even have three years of data to work with. Now I have fourteen. I did my best to find the participants but some of the national teams appear to have people that have never played in a GP or PT. They've been colored gray and given the starting rating of 1500. Some ratings may differ slightly from players' personal pages because they incorporate corrections and/or data from 2003-05 which hasn't been integrated into the site yet. (More on that next week!) You can sort this table by clicking on a column heading. Note that with only three people on each team, the middle rating is the median. If you'd prefer to limit the sort to only the teams with three rated players, here's the average sort with those teams filtered to the top. Mouseover a rating to see the name associated with it, or click on a country to make the names appear. The blue rating is the team captain and the red rating is the national champion. Best of luck to all participating teams! |
| 2017 October 04 |
The World Championship is this weekend! In preparation I've put together a couple of pages of stats. I tweeted them out earlier this week, but so that they're all in one place, here's some links:
|
| 2017 September 10 |
| Another couple of years have been added to the site. Thanks to work I did for Bob Huang's series of articles on CFB I had already put together data for GP Philadelphia 2005, so I did a little bit of 2005 to reach that GP specifically (November 12, 2005). I think we'll run out of useable information in about two more batches. My goal is to do the next one by the end of October, but that might be pushing it. |
| 2017 August 26 | ||||||||||||||||||||||||||||||||||||||||||||||||||||||||||||||||||||||||||||||||||||||||||||||||||||||||||||||||||||||||||||||||||||||||||||||||||||||||||||||||
|
I tweeted this chart out when I updated with GP Denver but I realized it belonged here as well. Brad Nelson has had a crazy last four GPs: an undefeated win in Omaha, then a 6-0 drafting performance for 13-2 in Kyoto (he finished 11th on breakers), then he reached the top 8 of Minneapolis (lost in quarters), and now he's won again in Denver. Making top 8 in three GPs out of four attended is pretty rare — only eleven people have done it (some multiple times) and it hasn't been done in two years. Made top 8 in three Grands Prix out of four attended. (bold: top 8, blue: win)
Note that Owen and Yuuya are the only two to have a streak of four individual GP top 8s in a row, and both of them were part of stretches of five out of six! (This table was updated on November 17, 2017.) |
| 2017 August 17 |
| Piggybacking on the script I wrote for the previous chart, there's now one for expected number of pro points based on your record. Interestingly, the "0-0" box reads 4.4; of course it slowly dwindles down to 3.0 as the number of losses ticks up toward eight. This says that a PT appearance is on average worth 4.4 pro points, and thus gold status is worth about 17.6 just from the four PT berths. |
| 2017 August 01 |
| I decided that instead of updating the chart in the post below with the results from PT Hour of Devastation, I should make a separate page for it which I'll update after every Pro Tour. |
| 2017 July 26 | |||||||||||||||||||||||||||||||||||||||||||||||||||||||||||||||||||||||||||||||||||||||||||||||||||||||||||||||||||||||||||||||||||||||||
|
Yesterday I worked on recreating my favorite FiveThirtyEight infographic using the data we've collected from the site. If you're following me on Twitter, you probably saw some escapades as I tried repeatedly to get this right, and even the final image that I posted wound up slightly off. >.< The biggest culprit was the play-in rounds of Pro Tour Kaladesh and Pro Tour Aether Revolt, which deeply confused my script that attempted to figure out who was in the top 8 of a given event. Second-biggest was PT Kyoto 2009, which apparently only had 14 rounds of Swiss, and my program then gave everyone a bye in rounds 15 and 16. ^_^; Oops. Here is, as far as I can tell, the correct table. This graph tabulates the percentage of players with a given record that have gone on to make the top 8. Data comes from all 16 round split-format PTs (ones with both draft and constructed). That's the last 28 tournaments. Some multi-draw columns were omitted due to small sample sizes. You can now mouseover the cells (or tap them on mobile) to see the data; the tooltip shows {the number of people who made top 8 after having this record} / {the number of people who have had that record in total}.
If you'd prefer an image of this table for whatever reason, here's an .png file. This will always lead to a current version of the chart. Here's a couple of notes about the unlikely numbers in the table.
|
| 2017 July 21 |
|
2008 and 2009 were integrated into the site yesterday. This update added 48 tournaments and around 140,000 matches. The site is big: 363 tournaments and almost 1.7 million matches in total now. The curating process is getting faster, though I expect that the scraping process will compensate by getting more difficult. So far I've been able to recover every round except for GP Costa Rica 2012, round 2. I bet in the next two years we'll come across a GP whose data is bad enough that we'll have to let a few rounds go. Just in time for PT Kyoto 2017 I've added the previous time the Tour has stopped in Kansai. So it's time for a pop quiz: Who won PT Kyoto 2009? I knew going into the project that there are people in different parts of the world that have the same name, but I didn't appreciate the problem of two people being in the same part of the world, ten years apart, with the same name. That is, until I had to try to reconcile results from 2008 with results from 2017. I'm doing my best, but stuff slips through the cracks. Your help in correcting the data is always dearly appreciated. |
| 2017 July 03 |
|
Late last week I went through every tournament since 2010 and determined the format played in each round. Often we get asked for information about Elo by format, and I want to discuss the issues with those ratings today.
There are two main problems that are difficult to overcome, both stemming from small sample sizes. The first is a global problem: very few people have played enough matches in any given format for the ratings to mean much. Like I said in the previous post, it takes around 125 matches before the ratings settle down. 125 matches is a lot at this level. Only 319 people have played 125 matches of standard since 1/1/10, and standard is the most played format. Of the ~148,000 people in the database, only 14.9% of them have played in even five tournaments total, and of those only 2.8% have played in five standard tournaments. With only a couple of tournaments under your belt, your rating is basically determined by your record; the extra couple of points you gain/lose from playing a better/worse rated player haven't accumulated to anything significant yet. So you might as well just track your record or your win percentage. This leads to another important point: there are basically no second-order effects because very few opponents have played enough matches to have reached a stable rating. Elo won't know whether to appropriately reward or punish your results because it won't have an accurate measure of your opponents' skill. Because of this, the ratings for even the people who have played a lot need to be taken with a grain of salt. Whereas in most GPs pros are playing against people with byes and so are playing people who have played a least a few GPs before, if we limit it to, say, modern matches only, then the otherwise-experienced opponents by and large don't have enough matches to have a stable rating, and so the number of points on the line in each match may be way out of whack. (Cognoscenti may realize that a way to mitigate this issue is to use a different rating system, like Glicko, that reports a confidence interval instead of a single number. Someday I'd like to look into this, but today is not that day.) The lack of second-order effects would also make calibrating K for each different format a nightmare, because the results will seem kind of random. The rating system will have a lot of "this win was very unexpected for someone rated 1550!" moments, whereas it's actually because the 1550 player should be rated 1800 but hasn't played enough legacy to have reached that yet. To be fair, these problems are inherent in trying to rate people based on their results in premier tournaments: 80% of people here have played in three tournaments or less. The reasons for this are myriad; I'll leave it as an exercise to imagine as many as you can. But these problems are amplified much further if we compound the problem by limiting the data available to be based only on results in one format. With Magic Online, in contrast, every match you play is counted toward your rating, so you could quickly pile up hundreds of data points. If I had the information to create by-format FNM Elo or PPTQ Elo, those ratings would have a much better correlation with your skill, compared to the vagaries of the one modern GP that happened to be in your time zone when you had a tier 2 deck built. Having said all that, we still don't have any plans of integrating by-format Elo ratings into the site in the near term. I just don't think they tell an interesting story. If you want to compare people, it's probably better to do it by some other metric, like win percentage. To that end, you can now find on the stats hub a leaderboard for win percentage by format. I'll keep this updated after each new tournament. I built it from my local copy of the database using Python, so it has its limitations. Still, if your goal was to confirm that Brad Nelson is good at standard or that Joe Lossett is good at legacy, I think it will be satisfactory. As a super-special, one-time-only, no-plans-on-doing-this-again-soon, thanks-for-reading-this-far kind of thing, I also ran the numbers for by-format Elo. View them in light of all the caveats I've laid out. |
| 2017 July 01 |
|
As promised, I've got some information about the project to recalibrate our K constant today. K is a parameter in the Elo rating system that determines how many points each match is worth. Right now ours is set to K=36, which means that the two participants in a match bring 36 points to the table for each match. If the players have exactly the same rating, then both players "ante up" 18 points. Otherwise the higher-rated player will risk some P (greater than 18) of their points on the match, with the lower-rated player contributing 36 - P points of theirs. As K increases, each match is worth more points, so the ratings become more volatile. This causes there to be less information in the ratings, since the effects of matches from long ago are drowned out when every match is causing a big swing. With the current value of K, the ratings stop being sensitive to a single old match after about 45 matches, and the effect of an entire tournament is blunted once we reach about 125 matches. In short, my plan for recalibrating K was to adjust the value of the constant, rate everyone, and then go back and examine everyone's ratings at the time of each of their matches. The Elo formula predicts certain values for those win percentages, like the higher-rated player should win 60% of the time if the ratings disparity is exactly 200 points. So we should try to pick the rating scheme that causes the data to best fit the model: this maximizes the meaning that the ratings have. I tried a bunch of different constants and a couple of different rating schemes. The results are summarized in this Google spreadsheet. I encourage you to take look at some of the alternative models that I examined there. Here's a look at how the current system (every match is K=36) is doing.
Here's my concern. This is the same graph again, but where instead of looking at every match, we only look at matches between people who have already completed 25 matches. Your rating isn't necessarily correct at first, so this gives people a "provisional period" to get closer to their actual rating before we start counting their matches as being useful data toward the calibration process.
This probably should lead you to propose a system where matches between veterans are played at a lower K than matches where one of the participants still has a "provisional" rating. I examined those sorts of rating schemes in the spreadsheet too. Do any of them look appreciably better than the pictures in this blog post of a flat K=36? Maybe a K=36 / veterans at K=27 split is a tiny bit better, but I don't think it's a big enough improvement to warrant a switch. Also I should point out here that making matches between veterans have a lower K-value does something very counterintuitive: it nerfs the impact of Pro Tour events, where essentially everyone is a veteran. This is the opposite of how most people seem to think it should go — in fact I've had multiple people tell me that it's blasphemous that we're not using a higher value of K for Pro Tour events! It is true that in the old DCI rating scheme, Pro Tours had a value of K that was 1.2 times the value of K for Grand Prix. But the DCI rating scheme was also supposed to be a world ranking of sorts. It needed to be built into the system that winning the Pro Tour would be a guaranteed massive boost to your rating. The Elo project is, as we've said, for entertainment purposes only, so I don't lose sleep at night over this. There is an effect that increases the value of a deep run at a Pro Tour: the average rating in the room is much higher, so you see many more matches worth 18 points to each player and fewer of the 6/30 variety. For a player with a high rating, a Pro Tour is the best chance to push their rating up even higher. (It seems that once you reach a rating of around 2100, going 8-4 at a GP — that is, 11-4 with three byes — might not even be enough to tread water. On the other hand many people in the same range made some progress at PT Amonkhet going 11-5 or 10-6.) As K varies, all of the different rating schemes have trouble at the high end, independent of the small sample size issues. The underlying shape each graph wants to make has more of a bend to it than the red graph has. I think this reflects the fact that win percentages over 70% aren't seen at this level of play. Less than thirty people who have played 200 matches have a 65% lifetime win percentage. So it's possible that the right way to improve the ratings on the site is to change the Elo model itself by lessening the expectation once we get over a 300 point disparity or so. Let me offer a counterargument to the previous paragraph. (This either goes to show that I've thought about this all too much or that it's a really complicated problem.) Most of the matches with really large rating disparity involve someone who's been on a heater and has a 2000+ rating playing against someone with a rating in the 1500-1600 range. A 1600 rated player is still pretty good; that's someone who's at or slightly above .500 in their premier play career. I think we'd expect to see a better performance from the higher-rated player in matches with a huge disparity if we could get some matches between, like, 1700s and 1200s. But these by and large do not exist! There are two reasons: (1) people with 1700+ ratings typically have two byes, and so avoid a lot of the weaker players who have no byes, and (2) people whose actual skill would lead them to have a rating of 1200 or below tend not to play enough matches to reach their actual rating in the first place, because there's no incentive to stay in the tournament after you've lost a bunch. For a player like Owen Turtenwald who deserves a rating in the 2000s which means "I 11-4 every GP," he'll naturally arrive at that rating by 11-4'ing every GP. But if you deserve a rating that says "I basically 2-7 every day one," getting the total number of matches needed to arrive in the ballpark of that rating is very difficult. This was a 1250-word way of saying that I'm not going to make any adjustments at the moment. There are two other factors that have to get weighed against making any changes: continuity and simplicity. I'd prefer not to change the scale in such a way that old blog posts, graphics, Reddit threads, etc., stop corresponding to what's on the site. And I'd also prefer for the rating system to be something that can be explained in one paragraph, if a two-paragraph or five-page mathematics paper version doesn't seem to lead to any real improvement. This isn't to say I'm done looking for better options (the idea of tweaking the underlying model is intriguing!) but for now it's back to the curating process for 2008-09. You may be able to infer from this blog post that I could talk about this endlessly; if so you would be correct. I'd love to hear any thoughts or suggestions you might have about this topic! Send them to mtgeloproject at gmail dot com. |
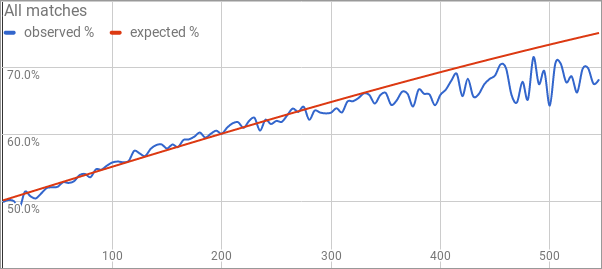 The horizontal axis is the rating discrepancy between the two participants in a match, with the win percentage of the higher-rated player on the vertical axis. Honestly, of all the rating schemes, this one seems to do the best when it takes every match into consideration. This shouldn't be too amazing; I chose K=36 at the beginning of the project because it seemed like the best choice for K at the time. Keep in mind that there are very few matches between players that have a 400+-point rating disparity, so the tail begins to wobble due to the effects of a small sample size.
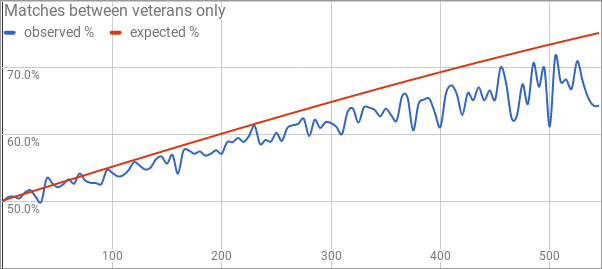 In these matches between "veterans" we're consistently falling short of the target line. This is what initially made me say a few months ago that K=36 is too large. It leads to people achieving ratings higher than they're "supposed" to have, and so the higher-rated player loses more often than Elo is predicting. This undershooting effect is less pronounced with K=27 or K=30, as you can see on the spreadsheet.
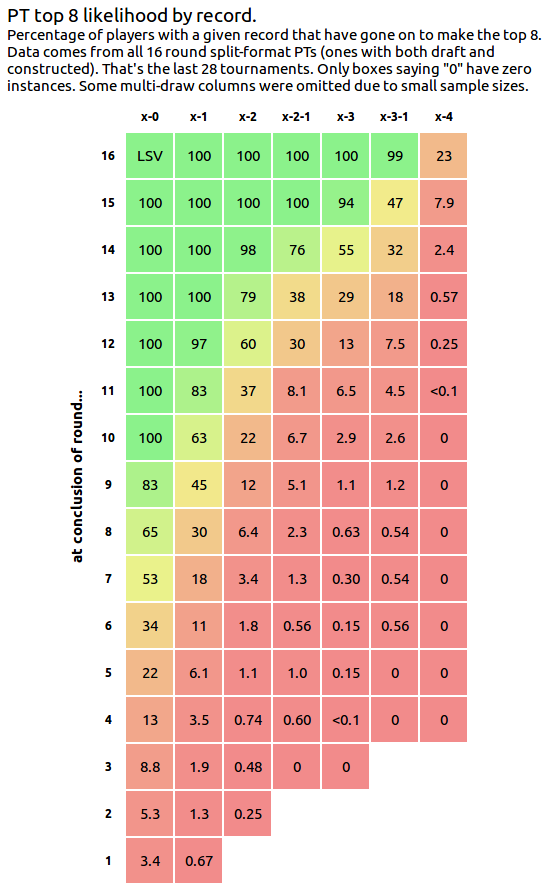
| 2017 June 26 | ||||||||||||||||||||||||||||||||||||||||||
|
Since we just had two additions to this table in the last couple of weeks, it feels like a good time to post it here. This is a list of everyone, since 2008, who has won a GP without losing a match. No one has ever actually won every match they were paired for, though this is largely a matter of deciding how you count intentional draws.
We have raw 2008-09 data now; it's going to take a couple of weeks to curate it, but it's good enough to decide whether the winner lost at some point during the tournament or not. The table only lists the record in rounds played, i.e., byes are ignored. This is why the win totals might look low at first blush. Richard Parker only had one bye in GP Lille, so he got an extra couple of matches in at the beginning. This is an insane accomplishment, but it is actually not the record for wins in a single GP: that distinction goes to Brock Parker, who won GP Pittsburgh 2013 with zero byes, going 17-2-0-0 in the event. He was helped by the fact that there was a tenth round of sealed deck played on day one. Given that all current Grand Prix (and almost all older ones) involve fifteen or fewer rounds of Swiss, it seems very likely that no one else has managed 17 wins in one GP. |
| 2017 June 13 |
|
2010 and 2011 were integrated into the system a couple days ago. This update added 46 tournaments and just short of 170,000 matches. This pushes us over the 300 tournament mark. There's 1.49 million matches of Magic catalogued here. Based on the data from a couple posts ago, I think we're at about 48.6% of all tournaments and maybe 55% of what we can possibly get. I'm hoping to stay on the pace of two years every two months like I've done so far, but we do have some behind the scenes work to do as well, so we shall see. The next two years total 48 tournaments, but the tournaments are also getting smaller, so my fingers are crossed that the total amount of stuff to swim through will decrease. Unsurprisingly I'm getting faster and faster at the curating process, but there's a lot of name-reformatting that has to happen between scraping the raw data and adding it to the site. For 2010-11, the raw data had 17784 unfamiliar names and the curating process pared that down to 11521 new people. Naturally I missed some, and also some entries have data from multiple people in them. But this is what's gained from working on the data some. At the moment K = 36 still. I thought K = 30 or K = 32 would give more predictive power, but there's a baseline level of noise that no value of K seems to mitigate. I thought this comes from the fact that people near 1500 are often grossly misrated, but the effect seems to persist even when we only look at people who have already played 25 matches (admittedly a much smaller data set). I'm still messing around with variable-K schemes and other slightly more complicated rating methods, but I'm not going to change anything until I get something that I can confidently say fits the data better than what we have now. Otherwise there's no reason not to prefer continuity. I put some data together for this update, but I think I can present it better than I am right now, so I'm going to take a few extra days to improve it before I share. We still don't have a big problem with inactive players: it's true that 22642/146738 people in the database haven't played since before 1/1/13, but only 42(!) of those 22642 people have a rating of 1700+. (The highest rated such player is Ian Duke, at 1902.) I haven't figured out exactly what should happen if people play in an event after a long layoff, but isn't a big problem either -- only about 1350 people have had a gap of more than 200 tournaments (4-5 years) in their histories, and only 26 of those have a rating over 1700 currently. Probably there should be some sort of regression to the mean or something, but I bet doing nothing is fine too. As an extreme example, Corey Baumeister made the finals of GP Miami 2015 after a 3+ year layoff. We'll see what happens as we keep going back in time. I just don't want to discover that a spot in the top 30 is frozen on someone who stopped playing in 2005. At the least we'll set it up so that the rankings calculation only take into account people who have played within the last couple of years. There are people like Xu Su out there who don't play much but are very good when they play. (Finals of consecutive events, two years apart!) (But I assume real life made him decline the PT invites.) I don't want to cut those sorts of people out due to a hyper-focus on the week-to-week grind of the tour. |
| 2017 May 23 | ||||||||||||||||||||||||||||||||||||||||||
|
I believe that GP Montreal last weekend marks the fifteenth occurrence since 1/1/2010 that tables 1, 2, 3, and 4 at an event have chosen to ID. In three of those, it was a clean cut to the top eight: the eight people who drew were guaranteed to have more match points than the rest of the field. In the other twelve instances it came down to tiebreakers and/or the results of pairdowns. Here's how the eight IDers finished, by event.
Only in three(!) of the twelve tournaments where there was suspense did the eight IDers make the top eight. Be careful when drawing, people! |
| 2017 April 28 |
|
We've upgraded some of the pages at the left. The leaders page has been expanded and is more sortable than before. You can look arrange the table by rating as usual, or now by record or winning percentage by tournament type. It also expands to the top 150; this change needed to happen at some point because the people near the top are all very close to each other, so it was pretty capricious who happened to appear when we only had a top thirty. It felt like an overload to see the whole top 150 by default on mobile though, so we kept the shorter option too. At the moment, 65 PT wins will get you 150th place. I wonder how far up that number will go once we're done adding tournaments to the beginning of the data set. To make room for this, we've moved the histogram/percentiles table to a new stats hub. There are a couple of other widgets there, linking to pages that document some of the ancillary things we've blogged or tweeted about. You can find the table of unintentional draw streaks there, for instance. The plan is to add more of these as we go along. I want to add a Weeks at #1 page that lists who's been the highest-rated player and for how many weeks, for instance. If you have other suggestions for stats we can track, we'd love to hear them! |
| 2017 April 01 |
|
2012 has arrived! I finished curating the data early this week and set aside the time today to upload it and fix all the errors I uncovered while curating. This update adds 46 tournaments and around 170,000 matches. Some thoughts about our progress and what's yet to happen:
|
| 2017 January 30 |
|
Who among your friends has the highest rating? The highest peak? What's the average rating of your playtest group? Did you know that every member of Team Puzzle Quest has at some point in our dataset had the highest rating on the team, and also at some point had the lowest rating on the team? I have to confess, I'm kind of obsessed with playing around with the custom team page that we've just added to the site. Up to twelve players can be added to your team, and bookmarking the url lets you keep track of the progress and combined stats of a group of players all on one page. We would love any suggestions for improving this feature: are there stats you want to see that we left out? Is the limit of twelve too small? (That number was chosen somewhat arbitrarily, but we found that the graph looks pretty bad as you get up toward a dozen players.) Please let us know! This whole feature came about because we got an email a couple of months ago asking about a 'multisearch' and we thought it was a great idea. I love getting feature requests like that, so if you have any ideas, please do be in touch. A couple of quick notes and tips: hovering the mouse on the peak score of any player in the table will display the event and round of that peak as alt-text. If the graph is too muddied to read well, unchecking the boxes next to the player names along the bottom will toggle their graphs. The win percentages are computed as wins/results; in other words draws, intentional or otherwise, don't factor in. Of course on the theme of teams, we're also excited for the beginning of the Pro Tour Team Series. On the pro teams page you can view all thirty-two teams, sorted by average, median, best rating, or worst rating. Clicking on a team name drops down the list of members and a link to the custom team page for that team, where you can view the graph and aggregate statistics. We've also added a team button to the individual page of any member of a pro team, linking to the other members and the team page. Musashi narrowly comes out on top of Channelfireball – Ice in both average and median, a fact which seemed to impress one of its members:
(My rough translation: "[Musashi] leads not only in median but also in average, huh? It's expected that the two aces would be really strong; but for everyone on [Ice] to be over 2000 is incredible.") Of course, we can't be held responsible for any discord that might be sown among teammates by the statistics we provide...
Meanwhile in the arguably more important race, I believe that Almost Finnished edges out Conflagreece for most groan-worthy team name (although it's close!); and I have to give a shout-out to team Lingering Souls, which I think is my overall favorite name. ^_^ |
| 2017 January 23 |
|
We've incorporated all the rest of 2013 today in one big batch. That's 27 tournaments added at once, including Pro Tours Gatecrash and Dragon's Maze. Having several weeks off from new tournaments let me work on 2013 as a group which expedited the curating process. I might try to do something similar in the weeks around the release of Amonkhet. There's about 1.014 million matches in the database now, and in a couple of weeks we'll hit tournament number 200. I believe at the moment there have been 625 relevant tournaments total, so roughly a third now are available for your perusal. (Relevant being GPs, PTs, and Worlds. I'm thinking about tackling national championships too though.) The older tournaments are (a) smaller on average and (b) may not have usable records kept, so I'm guessing it's actually more like 40% to 45% of the possible database that's up now. Our data set is starting to reach a size where you can see peaks from different "eras" emerging. With each passing match an old result has a smaller and smaller effect on your current rating, so adding old data isn't useful if all you care about is what the current ratings are. But ratings as of several years ago are closer to the front of the dataset, so new additions to the front will still influence them. Huey hit a peak upon reaching 11-0 at Pro Tour Magic 2015 which has grown to become the fourth-highest mark ever attained (2305 at the time of writing). Other high points, like Sam Black's high at GP Toronto 2013, will be interesting to track once tournaments from 2012 start getting added. Despite what I said in the previous paragraph, if you're keeping careful attention you may have noticed that there's been a "rising tide" effect as I've added more results to the beginning of the data set. For example, LSV's rating was 2227 right when the World Championships were done, but since I've added a year to the front end of the data his rating has risen to 2258. This is almost entirely due to indirect contributions, rather than direct ones. Adding these tournaments has increased the rating of LSV's opponents, and so matches closer to the present look more impressive than they did previously. All boats rise due to this effect — even my rating went up about three points from the beginning of working on this cluster of tournaments. We'll continue to see this as we continue going back in time, since most people don't have a transcript long enough to make early tournaments irrelevant. There are ways to correct for this inflation, but I think it's a problem to tackle at a later date. In the last update, I said that I'd update the table of draw streaks each time I completed a year. The table in the entry below is now current. We found the beginning of some long streaks, like Christian Calcano's and Joe Demestrio's. Owen said on Twitter that he can't remember taking a draw, so if there is one it'll be a while before we come across it. How far back does LSV's streak go? In a little bit we'll peel back another layer. |
| 2016 December 20 |
|
I said I wasn't going to scrape for a little while, but I do have some data to share today. After a comment Reid made on Twitter, I got curious to figure out how long someone has gone without an unintentional draw. I've learned that This comes with the usual caveat that sometimes it's not super clear when a draw in a late round is or isn't intentional, but I've done the best I could. The streaks here do not include unintentional draws. By default, all streaks of Update (5/1/17): This table now has its own page accessible via the stats hub and is updated with each tournament.
|
| 2016 December 15 |
|
A couple of days ago I added Grand Prix Milwaukee 2016 to the site, meaning that all of 2014, 2015, and 2016 is here now. There's more than 820,000 matches in the database spanning 149 tournaments. Grading finals and completing a bit of math research is above scraping more tournaments for me at the moment, but I'll get in one more batch of corrections in a couple of days. My goal is to get to PT Theros (10 more tournaments to go) by the end of the year. |
| 2016 November 12 |
|
The World Magic Cup begins later this week! I've spent the last couple of days looking at the list of participants, trying to match them to entries in our database. Here's the fruits of that tree. Some teams have players that haven't played in a Grand Prix or Pro Tour in the last three years, so they've been assigned the starting value of 1500 (colored gray in the table). You can sort this table by average, median, top rated player, lowest rated player, or alphabetically. If you'd prefer to limit the sort to only the teams with four rated players, here's the average and median sort with those teams filtered to the top. Mouseover a rating to see the name associated with it, or click on a country to make the names appear. The bold rating is the team captain. Best of luck to all participating teams! |
| 2016 November 05 |
|
I've been keeping the database updated with new GPs as they've occured, and with each update I've managed to get one or two more old ones into the system. Today's update includes the just-finished GP Dallas (congratulations to Kevin Mackie and Skred!) as well as the next Pro Tour back in time, Born of the Gods. (That means it's time for another pop quiz: who won PTBNG?) This last month has seen the rise and fall of Shota Yasooka — he hit a peak of 2263 by winning the PT, then spent a hundred points going 2-4 in Malaysia. At the moment no one is above the "LSV line". We've gotten a number of good feature requests from the community in the last couple of weeks. I don't think we'll have time to add much to the site itself until winter break, but I look forward to implementing some of them. Until then I'll continue trying to bolster the database. We have six more GPs left to reach the beginning of 2014 and seventeen to go to reach the previous Pro Tour. Sounds like a lot, but we're well over a hundred tournaments now, so seventeen more doesn't sound that daunting any more. |
| 2016 October 12 |
|
New additions today: GP Beijing 2014, GP Atlanta 2016, and GP London 2016. Lukas Blohon went 2-3-1 drafting in London and it cost him eighty points! The perils of a 2300+ ranking... Best of luck to everyone participating in the Pro Tour! |
| 2016 September 25 |
|
I added five more GPs to the beginning of the timeline today, besides tidying up some high-probability duplicate entries. Today's innovation was to check every instance of a last name being shared by exactly two entries, to search for nicknames and typos in the first name. I'll do the reverse when I update next and look for mistakes in last names. Eight more GPs to go before I reach the next Pro Tour... |
| 2016 September 13 |
|
Refreshed the database again. Highlights from this update:
|
| 2016 September 05 |
|
The numbers in the previous analysis may be slightly off now, because I've just added four GPs to the beginning of the timeline: Grands Prix Boston-Worcester, Taipei, Milan, and Washington DC 2014. I also corrected about a hundred errors, some of which came from the community (thanks everyone! Keep it coming!) and some of which I stumbled across on my own as I was adding new people in. My goal is to get back to Pro Tour Journey Into Nyx for the update next week, so four more GPs to go. |
| 2016 September 04 | |||||||||||||||||||||||||||||||||||||||||||||||||||||||||||||||||||||||||||||||||||||||||||||||||||||||||||||||||||||||||||||
|
Here's an update to the table from the last enty, with the tournament complete. The deltas are all based on the positions entering the tournament. Congratulations to the world champion, Brian Braun-Duin!
Not shockingly the rating and ranking of the people who went 7-7 is very similar to their starting values. For instance, Reid's 7-7 changed his rating by 1.97 points (from 2068.35 to 2070.32) and his ranking from #19 to #20. Less obviously, Elo was not impressed by Blohon going 9-5. Given his schedule (i.e., that he played a player ranked 2066, then a player rated 2026, etc.), a correctly-rated 2320 should have won about 8.65 of their matches. So this was a slight overperformance in the system's eyes, hence a slight improvement to his record — he ascended from 2320 to 2332. Similarly, Niels performed shockingly close to expectation: his rating moved by only 0.75! He went from 1716.30 to 1715.65, a change small enough to be swallowed up by rounding. Again, the bulge of people in the low 1700s still meant that he was passed by twleve people. |
| 2016 September 01 | |||||||||||||||||||||||||||||||||||||||||||||||||||||||||||||||||||||||||||||||||||||||||||||||||||||||||||||||||||||||||||||
|
Since the field is small I was able to add the results from today's matches into the system. The 6-1 records from Brian Braun-Duin and Marcio Carvalho were worth close to a hundred Elo points each! These big swings are possible because each player in the tournament has a comparably stratospheric rating, so each match is worth a lot to each participant. (In contrast, a typical Grand Prix for a player with a 2100 rating is kind of like a college football schedule: a smattering of titanic clashes interspersed with the Elo equivalent of FBS teams.) Here's a look at how each player's ranking has changed. I'll update again on Saturday night after the back half of the Swiss rounds is in the books.
5-2 was about par for the course for Lukas, who maintains his incredible peak. It is certainly unsustainable, but I'm captivated to see how long he can continue to hold such a high rating. As Rebecca said in the post below, we shouldn't look at Lukas's high rating as an indication that he's that much more likely to win the tournament from this position. What Elo is picking up on is that his recent results (112-38 in his last 150 matches!) are consistent with the results of a real juggernaut. And to be fair to Niels, Elo didn't punish him too much for his 1-6 day — it only cost him about 46 points off his rating. Given the Elo ratings of the people he played, the ratings only expect that a 1716 player would manage 2.4 match wins. For comparison, a 1500 player would only expect about 1.76, and going 1-6 against that slate would only cost the 1500 player about 27 points. (These 25-to-50 point adjustments very small. Remember our rankings are "elongated," so that a 25-point difference only corresponds to around 1.25% of win expectency in any given match.) The fact that Niels has a large ranking delta just has to do with the fact that there are way more high-1600s players than there are players in the 1800s and above, so he fell past a big pack of people. |
| 2016 August 31 |
|
A quick note/musing on the Worlds simulation Adam posted about below: With no disrespect to Lukas Blohon, it's obvious that in no realistic model is he 16% to win the tournament. So why did the simulation come out that way, and does it mean that the expected win percentages that our model is assuming are pretty far off? Well, the short answer is no. When we look at all matches in our dataset between "veteran" players (three events or ten matches played), players whose rating is 195-205 points higher than their opponent have a 58.89% win percentage, which is very close to what the model expects. The problem is that at any given moment in time, the rating of any player who has just won a tournament or had a couple of deep runs is inflated a bit above their equilibrium point. When we take a snapshot of the current ratings, and then run a simulation forward only sixteen matches, the effect of that inflation is exaggerated. There would probably be a more "polls-plus" way to try to simulate the outcome of a given tournament, adjusting for recent big swings in rating, but it would take (a) a larger dataset (ours is still relatively small for the moment), and (b) more time. For now, if you're using our site to help make your MTG Worlds fantasy draft picks (as I have been!), take the actual match/tournament history data seriously, and the win probabilities as entertainment. ^_^ |
| 2016 August 28 | ||||||||||||||||||||||||||||||||||||||||||||||||||||||||||||||||||||||||||||||||||||||||||||||||||||||||||||||||||||||||||||||||||||||||||||||||||||||
|
The World Championship starts later this week. Here's links to the 24 people who will be competing for the trophy. The field has seven of the top eight (sorry Scott Lipp!) and half of the top thirty.
The right three columns were created by simulating the tournament one million times. They show the share of times that player wins the tournament or makes the top four, as well as his average number of wins in the Swiss portion of the tournament. I can't claim to be 100% sure that I got the pairings algorithm correct, but I did my best. I assumed that the draft pods would be between the people in positions 1-8, 9-16, and 17-24 respectively, that the drafts are seated randomly and that pairings in the drafts are based on seat, and that you can't play someone in constructed that you've already played in constructed (disregarding format). The latter two things might not be totally accurate (I'm guessing that #1 and #2 are encouraged to play in the first round of the second draft?), but I think it's probably close enough for the numbers to be in the ballpark. The outcome of each match is decided by flipping a weighted coin whose weight is determined by the Elo win expectency scheme. The ratings are updated after each round, so Lukas Blohon doesn't necessarily enjoy a stacked deck throughout the simulation. Mainly I was curious as to what Lukas's 120-point lead on the field in Elo translated to on a whole-tournament scale instead of an individual-match scale. It's rather sizeable. These numbers do highlight the limitations of Elo: I don't think that it's possible that Niels Noorlander's odds are really like one in 520 as the table suggests. In FiveThirtyEight parlance, this is much more of a now-cast than polls-plus. But if you want some food for thought while you fill out a fantasy draft, here you go. Good luck to everyone participating! |
| 2016 August 26 |
|
As part of a huge update fixing many typos and other small inconsistencies with the dataset, I went through David Williams's twitter feed. Big-name players who tweet about their tournaments are invaluable. Keep it up, guys. As part of this update I investigated: (a) every pair of names that were off by one character, (b) every person who played in two GPs that occured simultaneously, and (c) every entry that had a parenthetical nickname. This unearthed hundreds of pairs that I felt sure enough to combine, and some that needed to be split. As with any combining effort, there's going to be some false positives (entries that should not have been merged that were) and false negatives (names I should have merged but elected not to). Many of the false positives probably came from how I aggressively merged all "Yusuke" and "Ryusuke"-s into a corresponding "Yuusuke" and "Ryuusuke". But I think overall I improved the quality of the database by a sizeable margin. The update removed 486 duplicate entries. |
| 2016 August 23 |
|
A rundown of some arbitrary decisions that I have had to make in the last day or two...
I guess that's it for now. I'm also struggling with the ideal number of characters for the autocomplete on the search forms to begin making suggestions at, but that's not an incredibly exciting discussion. Meanwhile Adam continues to spend a crazy amount of time hunting down typos in the GP data. We're getting close to being in good enough shape to start showing the site off. ^_^ |
| 2016 August 22 |
|
Rebecca is awesome. She went from "it'd be fun to add graphs but it seems daunting" to "maybe I'll mess around with flot a bit" to having a graph generated for everyone who has played in at least five events. All in the span of a few hours. |
| 2016 August 13 |
|
GP Orlando 2014 was quite a struggle. First, it turned out that two different rounds had no results, with round 4 (Temur) the most egregious. Where is everybody? The page is blank. Then I realized that Temur rounds 1 and 2 included all of the Jeskai matches, and so I had to weed out the duplicates. Meanwhile, there was a mistake in the file I compiled that was meant to insert the matches into our database, and compounding that, the routine we wrote to fix the mistake itself had a mistake in it. Ugh. Very glad that's over with. |
| 2016 July 23 |
|
We've built a shell that lets us query the database up into a fully-functioning site in the last few days. It's a good feeling to have something more tangible than Python readouts and php admin pages. At the moment there are 83 Grand Prix in the system, from Pittsburgh 2016 back to Los Angeles 2014. More will be added after we finish creating the other pages, and progress on that front will be mentioned here. This space will also be used for other forays into the data set as we explore it. |